Dashboard
After logging in you land on the overview of all your devices. Clicking a device opens its device view with live values, history and costs. The sidebar on the left switches between Dashboard, My Devices and Tenant Access.
Overview
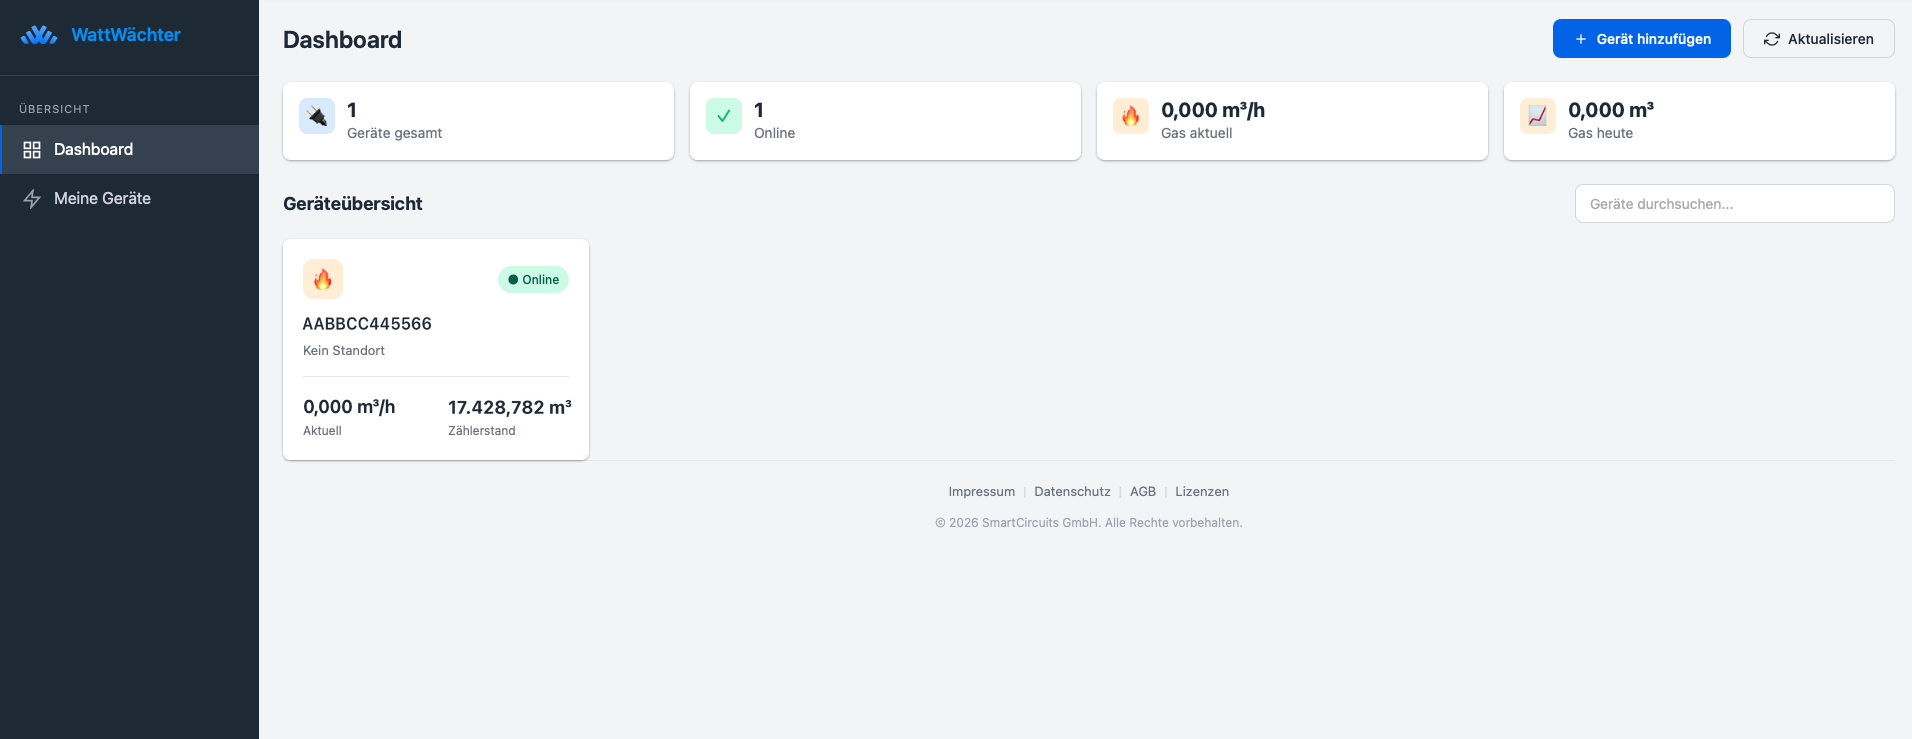
The dashboard sums up every device in your account:
- Total Devices and how many of them are online
- Current Consumption and today's consumption across all electricity meters — for gas meters Gas now and Gas today
- the Device Overview with the current value and meter reading of every device, with a search field
My Devices lists all devices with their location and when they last reported.
Device view
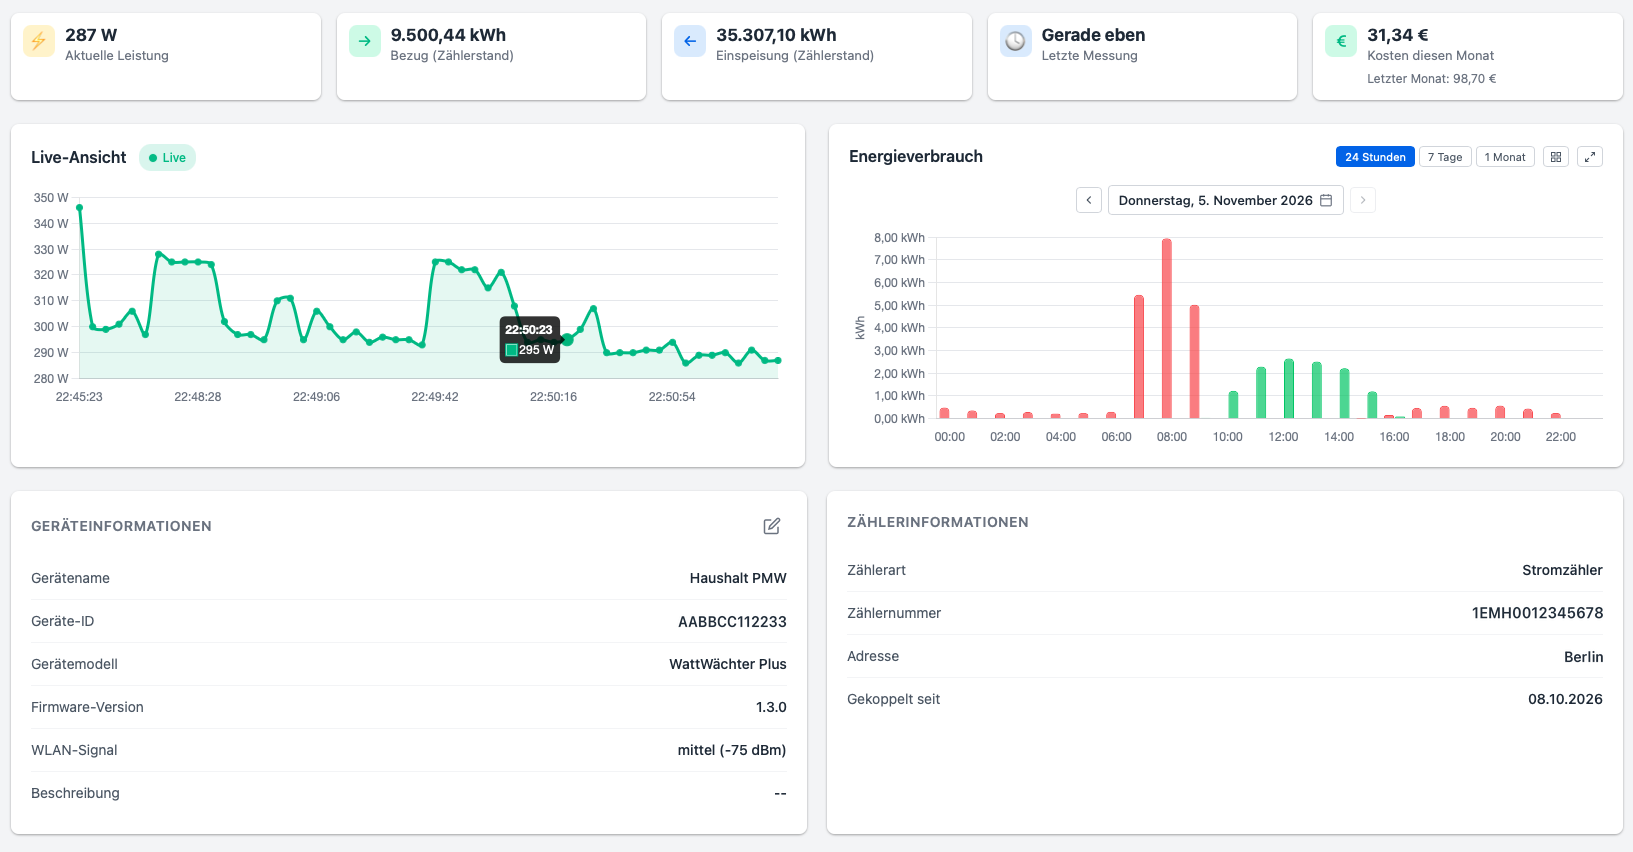
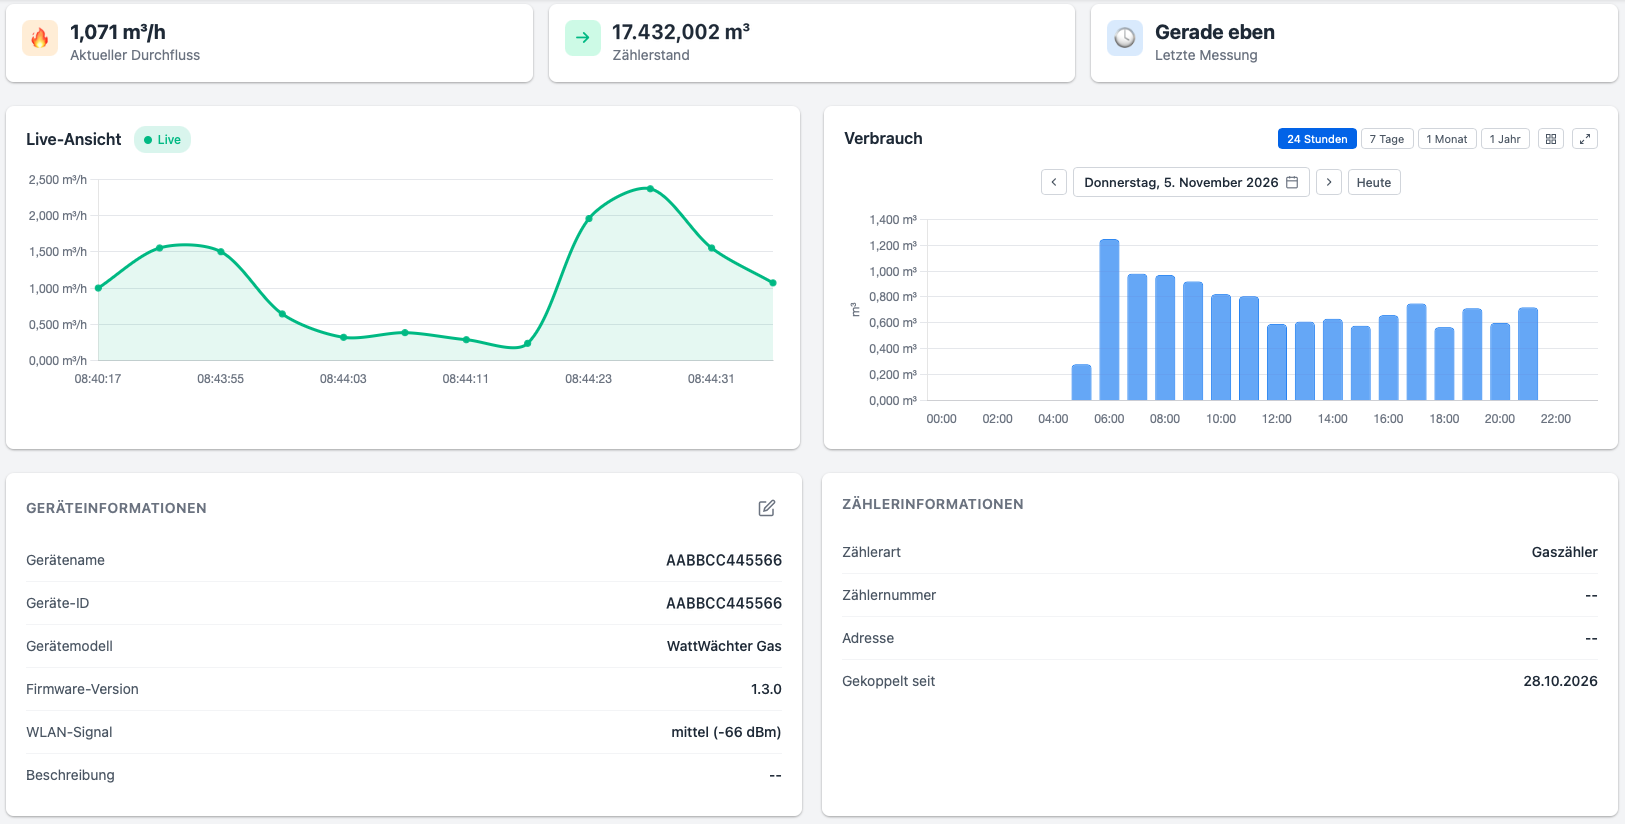
At the top right the device view shows whether the device is online; next to it you refresh the page or open the device settings (gear icon).
Tiles
| Tile | WattWächter Plus | WattWächter Gas |
|---|---|---|
| Current value | Current power in W | Current Flow in m³/h |
| Meter reading | Import and feed-in in kWh | Meter Reading in m³ |
| Last measurement | when the device last sent values | when the device last sent values |
| Costs | Cost This Month, with last month below (with an electricity tariff) | Cost This Month, with last month below (with a gas tariff) |
The costs tile appears once you have stored a tariff in the device settings — the portal calculates the costs with it. Below the charts there is then also the Electricity Costs or Gas Costs card with the costs per period; for gas it shows the consumption in kWh and m³ below. Without a tariff, this card asks you to add one.
Live view
The Live View shows the last few minutes and refreshes itself every 30 seconds while the device is online. Hover over the curve to see the time and value of each data point.
Energy consumption
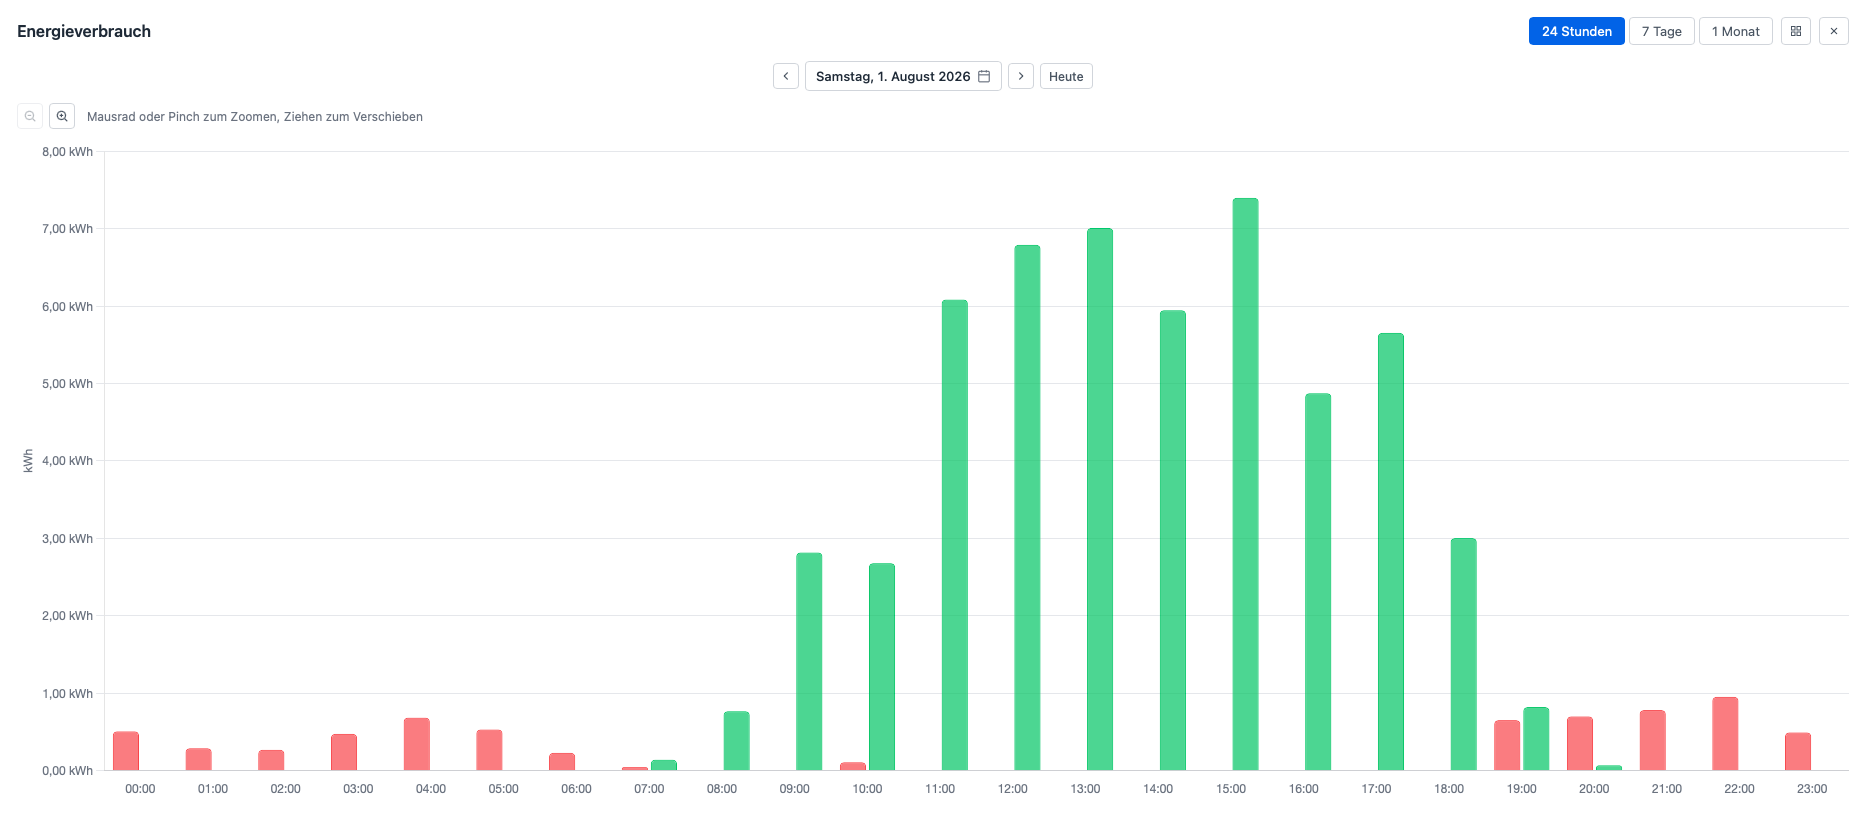
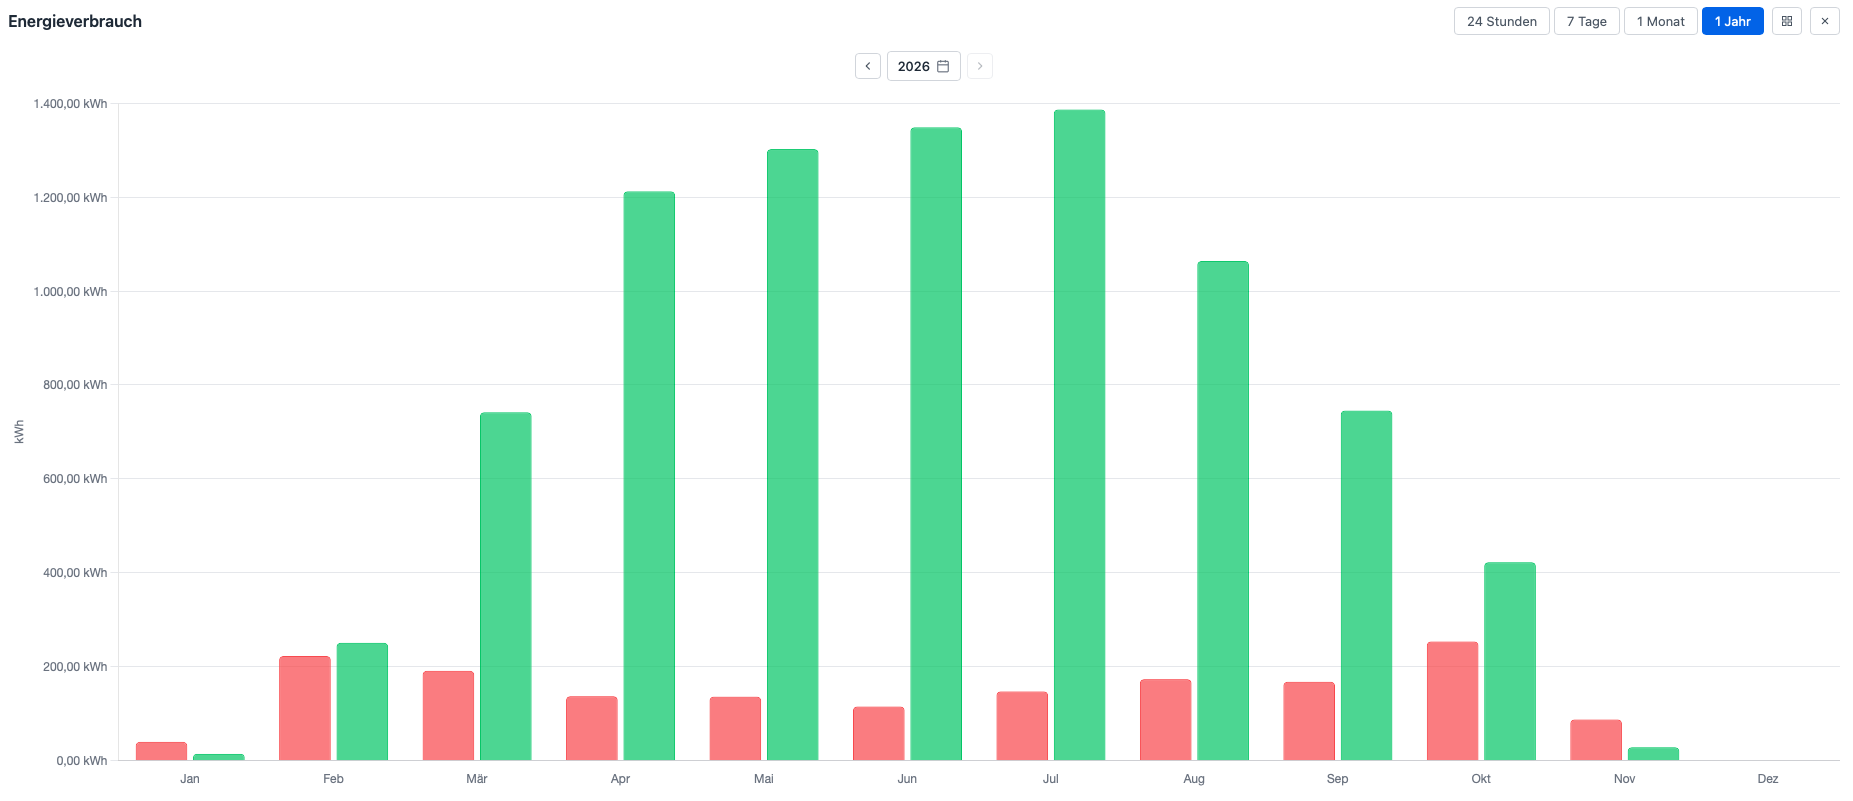
The Energy Consumption chart shows import (red) and feed-in (green) as bars — for 24 hours, 7 days, 1 month or 1 year. On the WattWächter Gas it is called Consumption and shows the m³ used per period.
- The arrows page to the previous or next period, the date jumps to a specific day, Today brings you back.
- The icon at the top right opens the Large view across the full width.
- In the large view you zoom with the mouse wheel or by pinching and pan by dragging.
Device and meter information
Below the charts you find the Device Information — device name, device ID, device model, firmware version, Wi-Fi signal and description — and the Meter Information with meter type, meter number, address and the date since the device has been paired. You change name, description and address with the pencil icon.
Device settings
The gear icon in the device view opens the device's settings. They are organised in tabs:
| Tab | Contents |
|---|---|
| General | Basic settings of the device — on the WattWächter Gas also the meter reading and meter exchange |
| Tariffs | Electricity or gas tariffs for the cost calculation |
| MQTT | The device's MQTT connection |
| System | Restart and update remotely |
| Export | Download readings as CSV — see below |
The portal sends changes to the device as soon as it is online.
Export
Under Export you download the stored readings of a device as a CSV file, for example for Excel. Choose the period (or This month, Last month, This year) and the resolution:
- Every reading — every stored data point, usually every 15 minutes
- Hourly, Daily or Monthly — the consumption per period
One file covers at most one year. Only the owner of the device can export, not a tenant.
When the device is offline
If the device is offline, the device view shows the last values received. If the device does report but without readings, a hint such as Meter not reporting appears instead of Online — then check the troubleshooting page of your device: Plus, Gas.